Deployments
The Deployments menu is the final step in configuring Video Vision, where all the flows, dashboards, and hardware are connected and assigned.
Only one deployment can be active at any given moment. Multiple active deployments are not currently supported.
Create a deployment
To create a deployment, follow these steps:
Click Create Deployment
Enter a name and description to distinguish the deployment easily.
Select the relevant timezone.
(Optional) Check Enable reporting to turn on Reporting.
(Optional) Set the long-term and short-term retention periods. You can adjust these values later in the deployment configuration.
Click Create.
Continue to Deployment configuration.
Configure deployment
Click Configure.
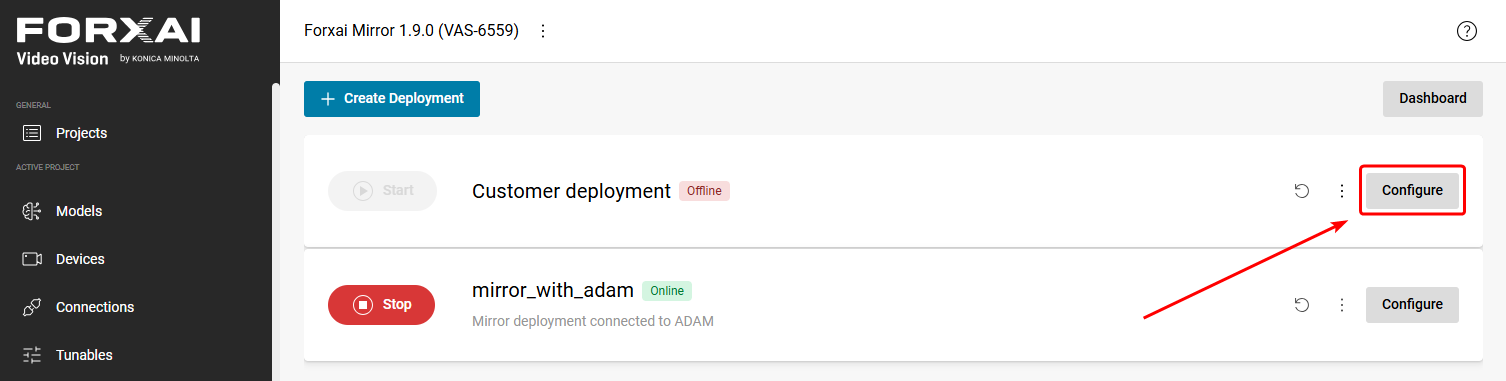
Click the ➕ button and select the flow you want to use from your created flows.
In the Devices section, assign any physical devices (e.g., cameras, I/O modules) connected to the deployment with the relevant input and output nodes, then click Next.
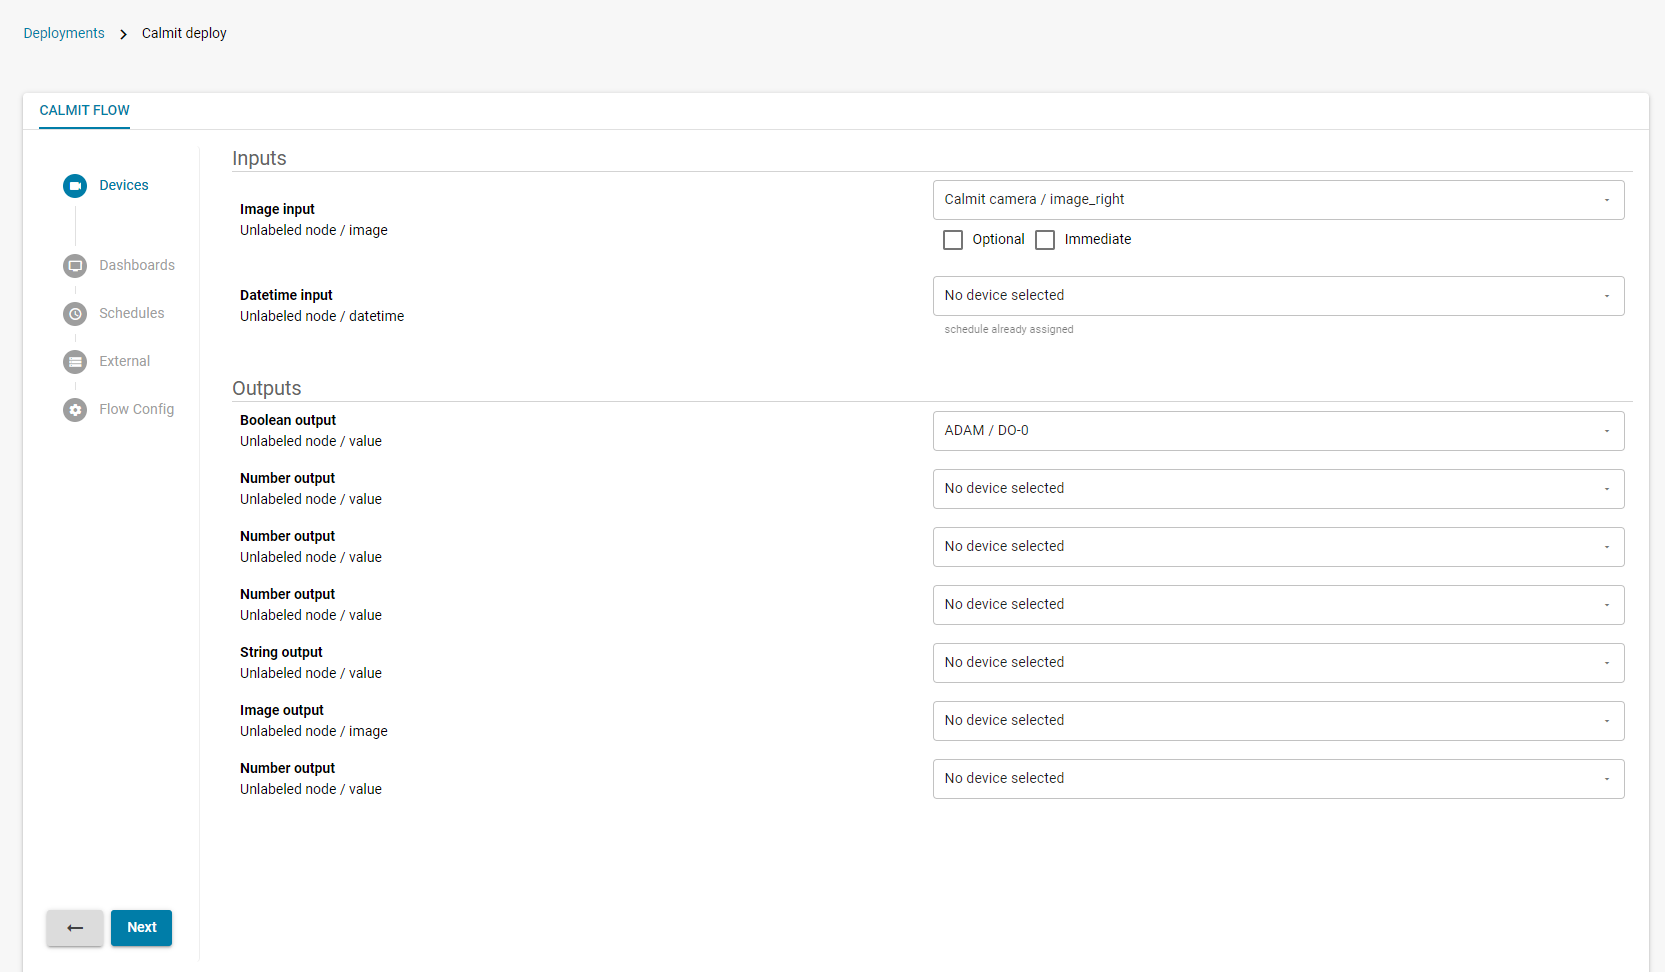
In the Dashboards section, click Add Dashboard, then select your pre-configured dashboard, then assign the Widgets to the appropriate flow outputs (e.g., a stream widget to an image output node).
Assign the Widgets to the appropriate flow outputs (e.g., a stream widget to an image output node).
If your deployment requires multiple dashboards, repeat steps 5 and 6 until you have configured all the dashboards.
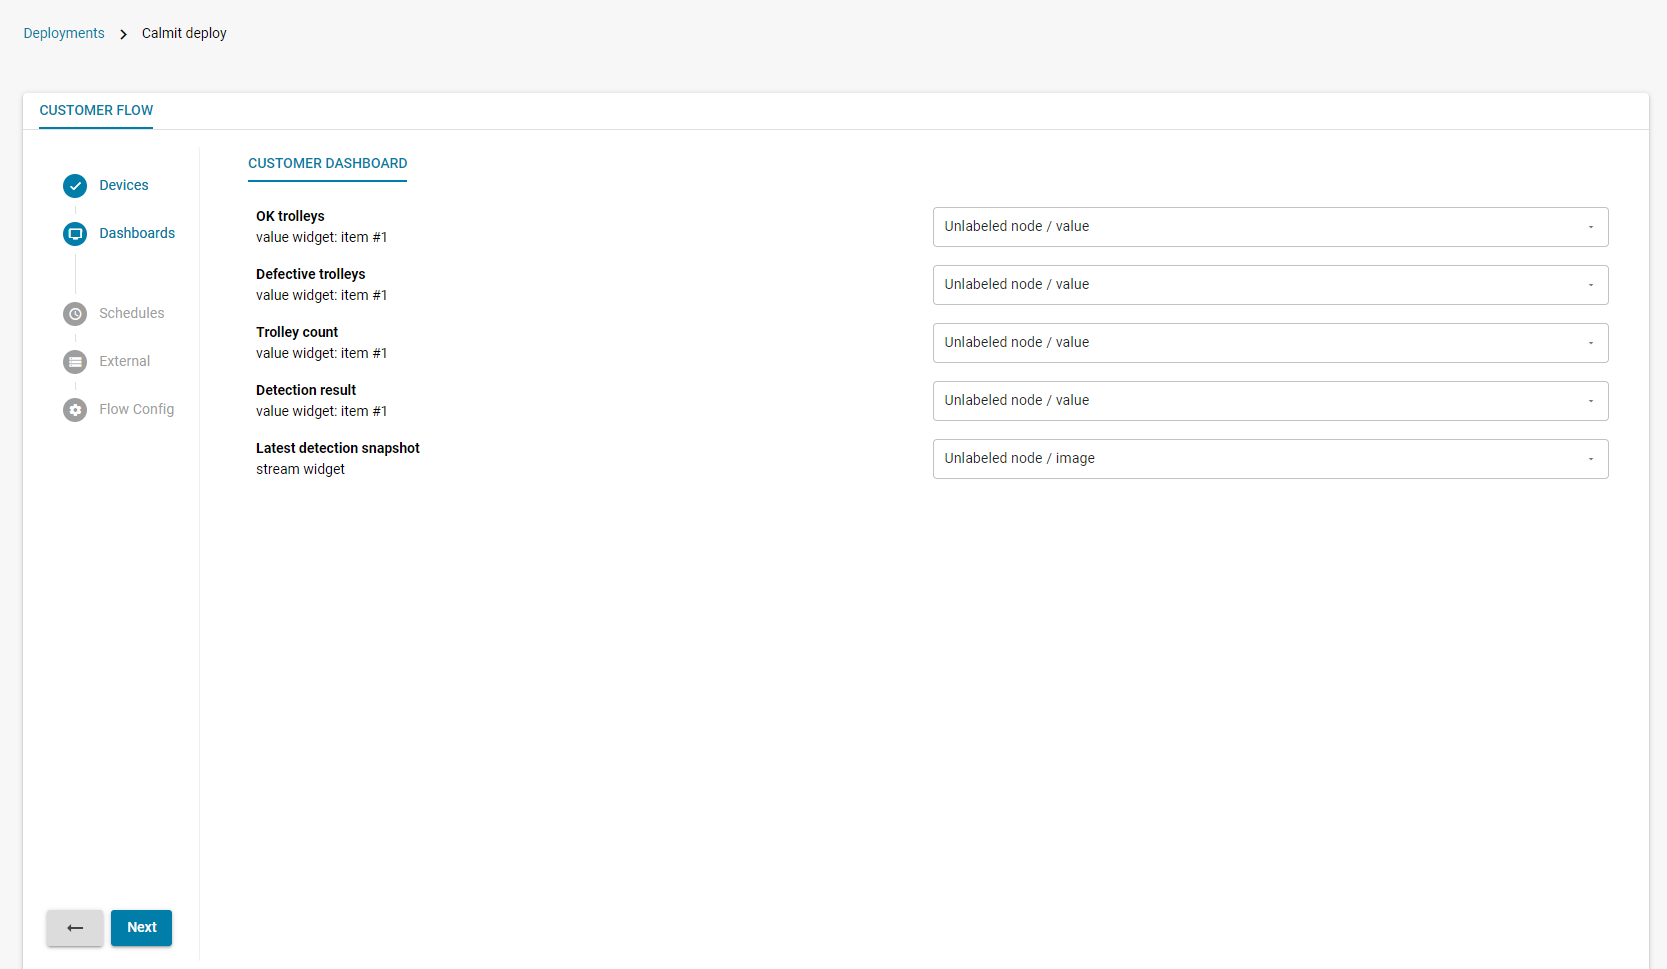
(If applicable) In the Schedules section, connect the appropriate Datetime nodes with the preset schedules, then click Next.
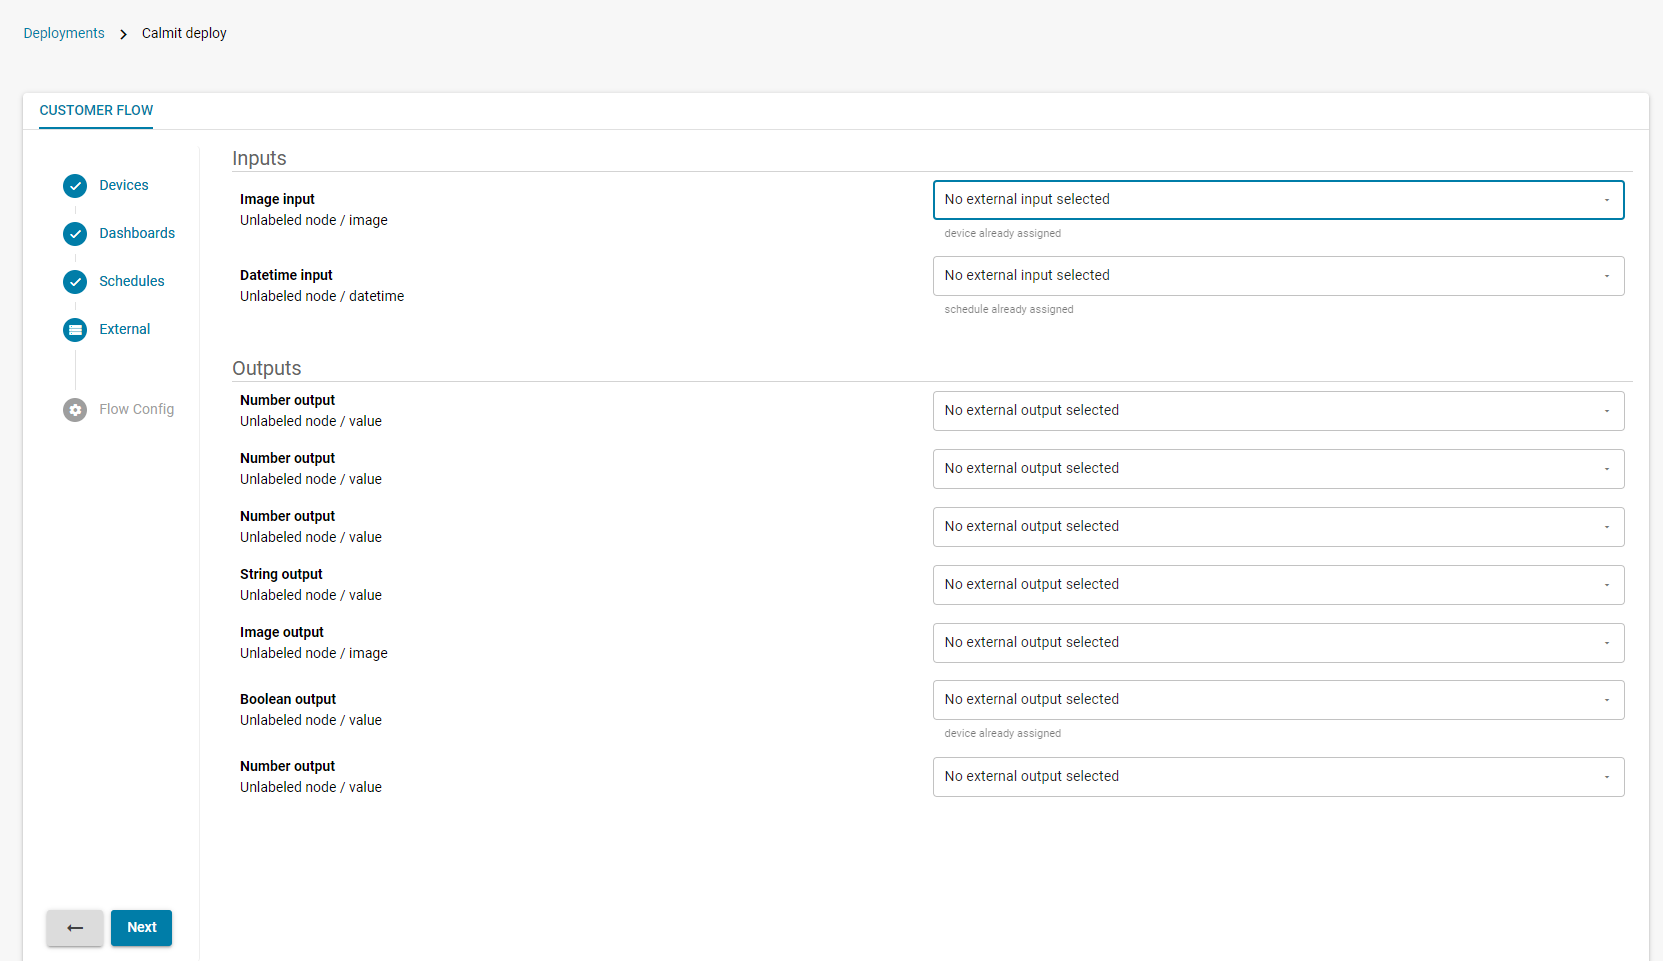
(If applicable) In the External section, assign the appropriate input and output nodes to relevant external devices, then click Next.
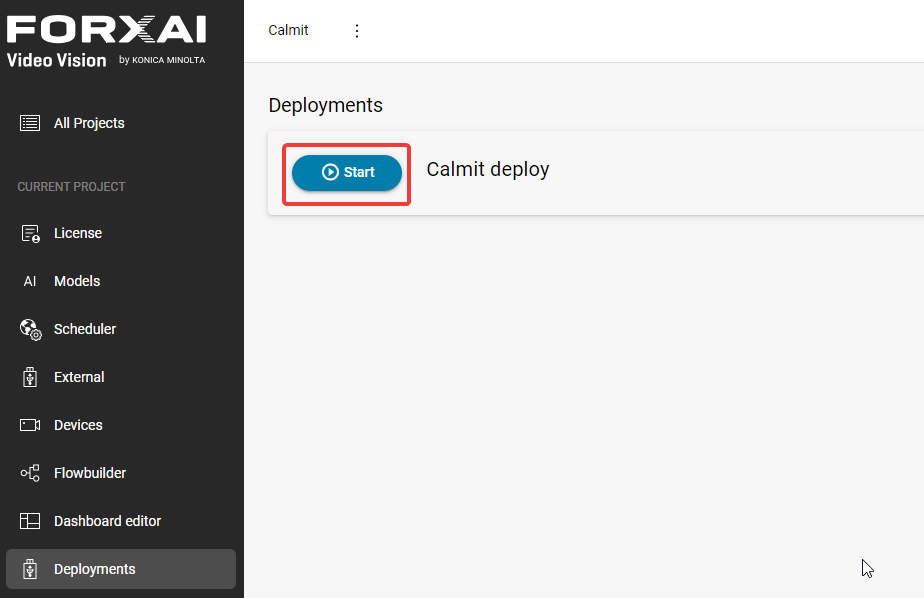
Return to the Deployments overview, then click Start to run the deployment.
Access the live dashboard
To view the live dashboard, click the Dashboard button in the top right corner.

This will give you access to the live dashboard, where you can view the configured solution and verify everything is working as intended.
The dashboard can take up to 20 seconds to load.
You can access the dashboard through the button at any time, but the content depends on the configuration of the deployment.